Key performance indicators (KPIs) should be used to guide business decisions. To achieve success in e-commerce, key performance indicators (KPIs) should be used as checkpoints. E-commerce business owners can track their sales, marketing, and customer service efforts with this data.
Your company’s specific objectives should guide your selection and tracking of key performance indicators. A few key performance indicators (KPIs) are useful for some objectives but not others. It is possible to think about a set of common performance indicators for ecommerce with the idea that KPIs should vary depending on the goal being measured.
Performance Indicators… What are they?
An indicator of performance is a measurable metric that can be compared to a target to assess progress toward that target. Some online stores may aim to increase their annual site traffic by a factor of 50 in the coming year.
One metric could be the unique daily visitors or the percentage of visitors from specific referral sites (paid advertising, search engine optimization, brand or display advertising, a YouTube video, etc.)
The definition of a KPI is as follows
While there may be many possible performance indicators for a given goal, this can be overwhelming. As a result, it is common practice to focus on just a handful of KPIs most critical to achieving that goal. Key performance indicators (KPIs) are the metrics that most clearly and concisely reveal whether a company is progressing toward its objective.
Why do we care so much about KPIs?
Key performance indicators are essential in the same way that strategy and goal-setting are. It’s easier to evaluate development with key performance indicators over time, and you’d be acting on assumptions, biases, and hunches rather than hard evidence. Key performance indicators (KPIs) help you learn more about your company and customers to make better strategic decisions.
However, Key Performance Indicators need to be More on Their Own. However, the real value is in the insights that can be put into practice due to analyzing the data. You’ll be able to pinpoint potential areas of improvement and, more precisely, plan for increased online sales.
In addition, key performance indicator data can be shared with the entire team. Use this time to teach your staff something new and get them together to solve an urgent problem.
What is the comparison between SLA and a KPI?
An SLA is a service level agreement, while a KPI indicates performance. In e-commerce, a service level agreement (SLA) defines the partnership parameters between a retailer and a supplier. You may have an SLA with your supplier or your digital marketing firm. We all know that a key performance indicator (KPI) is an operational metric. Key performance indicators are typically measurable, but they can also be qualitative.
Characteristics of Various KPIs
A wide variety of KPIs exist. They can reveal the past, foretell the future, or be of either type. Key performance indicators (KPIs) also encompass many aspects of daily business life. Most key performance indicators (KPIs) in the field of e-commerce can be placed into one of the following five classes:
- Sales
- Marketing
- Service to Manufacturers’ Clientele
- Management of Projects
Tips for Choosing the Right Key Performance Indicators in Online Shopping

There are many KPIs to track, but not all of them are essential to the growth of your e-commerce company. Therefore, here are some things to consider when picking eCommerce KPIs:
- Business objectives: Pick key performance indicators (KPIs) that will help you achieve your business goals and improve your bottom line (i.e., net income/net profit).
- Simple metrics to track KPIs: Pick Key Performance Indicators (KPIs) that can be easily measured and will give you (and your team) actionable insight into how your business is performing.
- Your company’s expansion phase: Pick Key Performance Indicators appropriate for the current phase of your company’s development. If your eCommerce company is in the early stages of its lifecycle, certain key performance indicators (KPIs) will be more important than others.
- Reality-based key performance indicators: Each eCommerce company has unique key performance indicators (KPIs), so it’s vital to pick metrics that are most relevant to your company rather than following industry or competitor trends.
- Always be concise and to the point: In this case, less is more. There’s no point in keeping track of a mountain of (useless and irrelevant) key performance indicators (KPIs). The best key performance indicators (KPIs) for your business should help you gain insights you can use immediately (and your team).
Top Key Performance Indicators
-
Abandonment of shopping cart percentage
In the world of online shopping, this phenomenon is known as “cart abandonment,” or a customer adds items to their cart but then leaves the site without completing the purchase. Unfortunately, this has happened.
Think of all the effort you put in until the point of checkout, only to have the customer back out at the last minute. You worked hard to create an attractive offer, attract their attention, build rapport, and bring them this close to making a purchase, but they abandoned their cart at the last moment. Worse still, it’s not an uncommon occurrence at all.
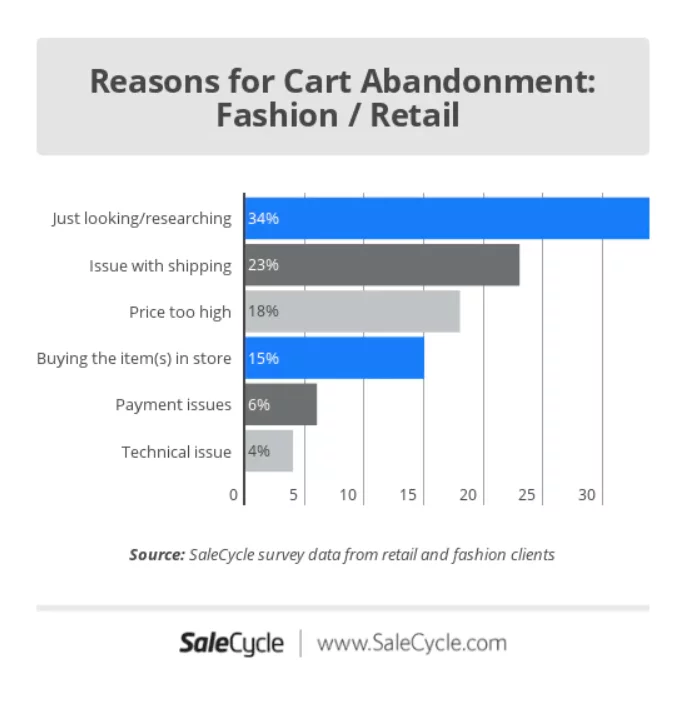
The Baymard Institute reports that roughly 70% of potential online shoppers still need to complete purchases after adding items to their virtual shopping carts. People leave their carts empty for whatever reason.
The reasons include visitors needing more time to be ready to buy, high shipping costs, website errors, a complicated checkout process, a declined card, and so on.

To determine the shopping cart abandonment rate, divide the number of completed purchases by the total number of shopping carts created. Subtract one from your number, then multiply it by 100 to get the percentage rate:
One minus (Sales Volume / New Shopping Carts) x 100 = Cart Abandonment Rate
The shopping cart abandonment rate is defined as the percentage of visitors who leave without purchasing after filling out a shopping cart.
1 – (50 ÷ 250) x 100 = 80%
-
Conversion Rate
How efficient are your sales pitches and CTAs? Is their only purpose looking nice, or are they helping you sell more stuff? Your rate of conversion will show you the truth.
The conversion rate of your website is the proportion of visitors who take some desired action while they are there. This could be anything from subscribing to a newsletter to buying something.
If you want to know how effectively your website is getting people to take action, look at your conversion rate. If, for instance, you have a high volume of visitors to a landing page that converts at a dismal rate, you should experiment with ways to boost conversions.
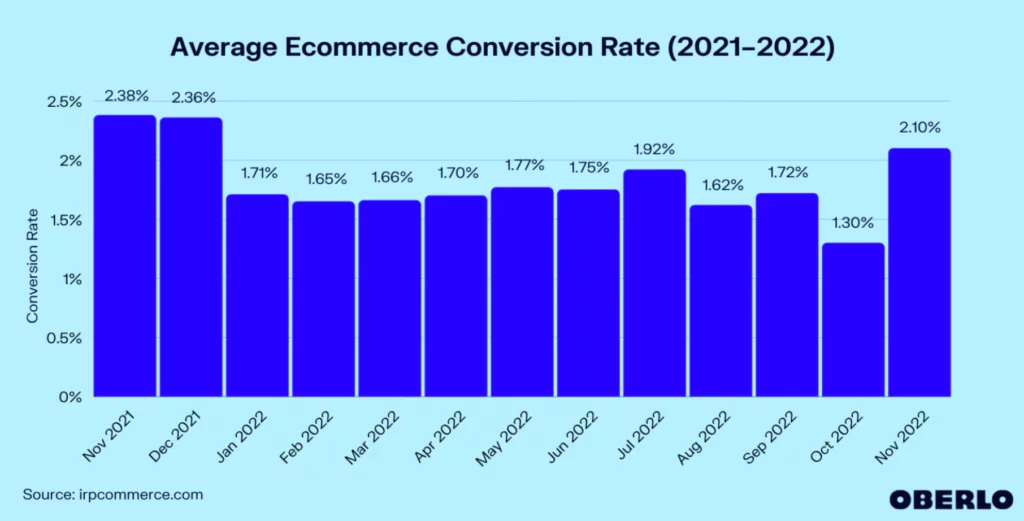
When converting, what percentage do you consider optimal? Globally, a 2% conversion rate is typical for online shoppers.

The conversion rate can be expressed as a percentage and is calculated by dividing the number of conversions (such as newsletter signups, purchases, etc.) by the total number of visitors to your online store and then multiplying that by 100.
The conversion rate can be calculated as follows: If you get 1,000 people to visit your website, and 50 of them buy something, your conversion rate is 5%.
Fifty Sales divided by One Thousand Visitors multiplied by One Hundred Percentage = Five Percent Conversion Rate
-
Customer acquisition cost (CAC)
The price a company must pay to “buy” a new client is the customer acquisition cost (CAC). Let’s say you invested $1,000 into advertising and marketing during a single month, and as a result, you signed 25 new clients. It would have cost you $40 to acquire each new customer. It is crucial to be aware of your CAC.
If your business sells industrial machinery with an average order value of $4,000, spending $100 to win a new client sounds like a dream come true. In contrast, if you’re selling $80 backpacks, you need to find a way to reduce your CAC drastically and fast.
That’s not all, though. Knowing your CAC, you can allocate your marketing funds following your target customer acquisition volume over a given period. Furthermore, you can take measures to lower your customer acquisition cost if you have a firm grasp of the variables and metrics that go into calculating it.
You must first understand it to control it. Investing more money into marketing will undoubtedly lead to increased sales. However, if your CAC also rises, your increased sales may result in lower profits. The bottom line is that your business could fail for reasons you can only begin to guess if you know how much it costs to convert a lead into a customer. Divide your total marketing and sales expenditures by the number of new customers they brought in, and you’ll have your customer acquisition cost.
Amount of Money Spent to Acquire Customers ÷ No. of Customers Acquired = Customer Acquisition Cost
-
Average order value (AOV)
AOV is a metric used in online retail that measures how much money buyers typically spend per transaction. Improving your average order value (AOV) may be a simple way to increase your earnings.
More money from each customer also means you can afford to spend more on marketing and still turn a profit. To determine the average order value for a specified period, divide the total revenue by the total number of orders received during that period.
Average Order Value = Revenue Divided By The Number Of Orders Placed
If you had 120 sales and made $10,000 in one month, your average order value would be $83.33.
-
Customer lifetime value (CLV)
The value of a customer to your company. CLV, CLTV, or LTV refers to a customer’s expected average net profit throughout the company’s relationship. It’s a difficult but necessary task to put a monetary value on each customer you have. It’s great for future planning and will aid in calculating your return on investment (ROI).
You can gauge your company’s success in customer retention using this metric. That’s incredibly important when you think about:
When retention rates are increased by just 5%, businesses can see a 25%-95% increase in their bottom line. The cost of acquiring a new customer is five to twenty-five times that of keeping an existing one. Repeat buyers are 67% more valuable than first-time buyers.
Average order value x Average number of times a customer buys per year x Average customer retention time in months or years = Customer Lifetime Value
-
Net Profit Margin
When running a business, there is a lot to think about, including developing products, promoting those products, recruiting employees, and providing quality customer service. However, one thing must always be kept in mind: Profit.
There can be no definition of “business” apart from the generation of profits. The money you make from selling something is called “revenue.” Subtracting expenses will leave us with a profit.
The percentage by which your profits exceed your revenues is known as your “net profit margin,” representing the total amount of money you make.
To illustrate, let’s say you spend $100 on bike parts. The next step is constructing a unique bicycle and offering it for $250. This results in a $150 profit, or a 60% margin.
If you want to know how well your company is doing, look at its net profit margin. Now, a healthy net margin is something to marvel at. A high net profit margin means you’ll have plenty of cash to put back into the company. However, a low net profit margin will hamper the company’s ability to bring in money and slow its expansion. You’ll need three pieces of information to determine your net profit margin:
How much money was made from sales as a whole? Total business expenses include production, advertising, running the business, paying employees, etc. Paying the government a portion of your earnings. Let’s start by figuring out your return. Subtract the cost of goods sold from your total revenue for the period in question.
Revenue minus expenses equals net profit.
The net profit margin is determined by multiplying one hundred times the net profit ratio by total revenue.
FAQs
What does it mean to have a leading indicator instead of a lagging indicator?
Leading indicators are metrics that help ensure businesses remain on track to meet their long-term goals. For online stores, these metrics provide early signals of success, such as the percentage of customers who buy related items. In contrast, lagging indicators evaluate past output and efficiency. They are simple to track but difficult to alter, making them ideal for gauging the success of current initiatives.
To what extent do non-financial and financial key performance indicators vary?
Key financial metrics are those derived from the elements of a company’s balance sheet and income statement. These key performance indicators assess how efficiently a business operates its resources to maintain steady operating profits.
Another metric used to evaluate a company’s performance is the non-financial key performance indicator. Employee and customer happiness, product quality, operational efficiency, and the company’s pipeline are common non-financial KPIs.
Which key performance indicators (KPIs) should an online store use?
- Rate of shopping cart abandonment
- Success in changing over
- Acquisition price per new customer
- Lifetime value of a customer
- Value of a typical order
- Profit margin after taxes


